Author: Peter Yang ( www. kaisutraders.com)
As I said in my previous posting on the introduction of symmetrical triangles in charting, I stated clearly that I am really a novice and just learned it from the computer.
The author of this article is Mr Peter Yang (www.kaisutraders.com) who is an expert and a professional fund manager. In fact he manages some of my money.
He has asked me to post this in my blog because he thinks that more people are interested in my blog.
Head and Shoulders (H&S) patterns appear on market tops and market bottoms.
Chart 1 below depict a typical H&S at market top.
Chart 1

The pattern consist of :
- Final Rally (market top) called the Head, that separates 2 smaller, not necessarily identical rallies which are called Shoulders. The Left Shoulder is the penultimate advance in the Bull Market while the Right Shoulder is the first bear market rally.
- Volume is important in the identification of the validity of these patterns. Volume is generally very high in the formation of the Left Shoulder and also tends to be quite heavy in the formation of the peak (Head).
- One can see the formation of a H&S Pattern when the Right Shoulder is formed which invariably is accompanied by distinctly lower volume.
- While a symmetrical Left and Right Shoulders are preferable, this is not an absolute requirement and they can be of different widths and heights.
- The Line joining the bottoms of 2 Shoulders is called the Neckline. Although Chart 1 show a horizontal neckline, there are a number of variations with the slope as can be seen in the Chart 2 below which is an ascending neckline. It can of course be a descending neckline as well. This is also the Support Line.
- Breaking thru the Neckline is an indication that there is a real desire to sell at lower prices especially when accompanied by an increase in volume which is a very potent factor in driving the price lower.
- H&S patterns can be formed in days, weeks, months and even years. So there is no hard and fast rule with regards to time in the formation of such a pattern.
Chart 2

Trading the H&S Patterns
As can be seen from Chart 2, the potential price target before one should theoretically buy the stock is the difference between the Price level at the Head and the Neckline (which we call “X”) subtracted from the breakdown from the Neckline. For example if the price at the Neckline breakdown is “P”, the target price that one should look at is P-X ( we call this “Y”) before one ventures to consider a Buy.
A word of caution though, as the pattern develops, there are other aspects of technical analysis that one needs to take account of, especially in identifying price and volume and it is not automatically that one should enter immediately at the “Y” price level and make profits on the way up. At times, the “Y” price level may not even be reached and like everything else, H&S patterns can fail and reversals can occur for eg the neckline is broken temporarily and then start to rally as there could be many influences on the stock price given the speed of news flow these days.
One needs to be well versed with other aspects of technical analysis to seize opportunities as they come along given that a rally can occur before the “Y” price level is reached.
Inverse Head & Shoulders.
Chart 3 shows a reverse H&S pattern which is a Bullish pattern as opposed to the regular H & S patterns. Typically on the bottom of the Left Shoulder, volume is relatively high and during the formation of the Head. Watch for the formation of the Right Shoulder, whose volume should contract during the decline to the trough and substantially increase on the breakout.
Chart 3
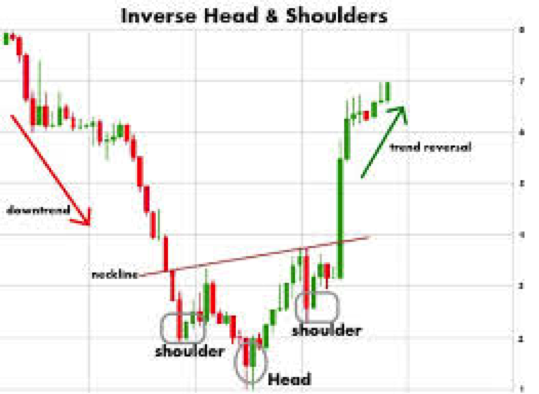
Again trading such patterns are the same as in the regular H&S pattern, with the target price set as per the regular H&S pattern, only now, it is on the upside for a possible price reversal at the top.
Example of H&S formation : Astral Supreme Berhad (ASUPREME Code : 7070)
Astral Supreme developed a H&S pattern in August to October 2012 with the Head formed on 28 Aug 2012. The chart is presented below with comments on the volume formations.
The share eventually reached a low of 0.14 on 27 June 2013 but before that, it rallied to reach a high of 0.27 on 27 Nov 2012.
Recently with the sell down in penny stocks, the share closed at 0.125 at noon break, 6 May 2014. The theoretical low of 0.05 for the rebound price had not been reached and as mentioned, one needs to have an understanding of technical analysis to advantage on the gyrations in the price swings of this stock for profit opportunities and not just rely on a single pattern for entry and exit purposes.
ASUPREME Daily Chart