Koon Yew Yin 25 Aug 2020
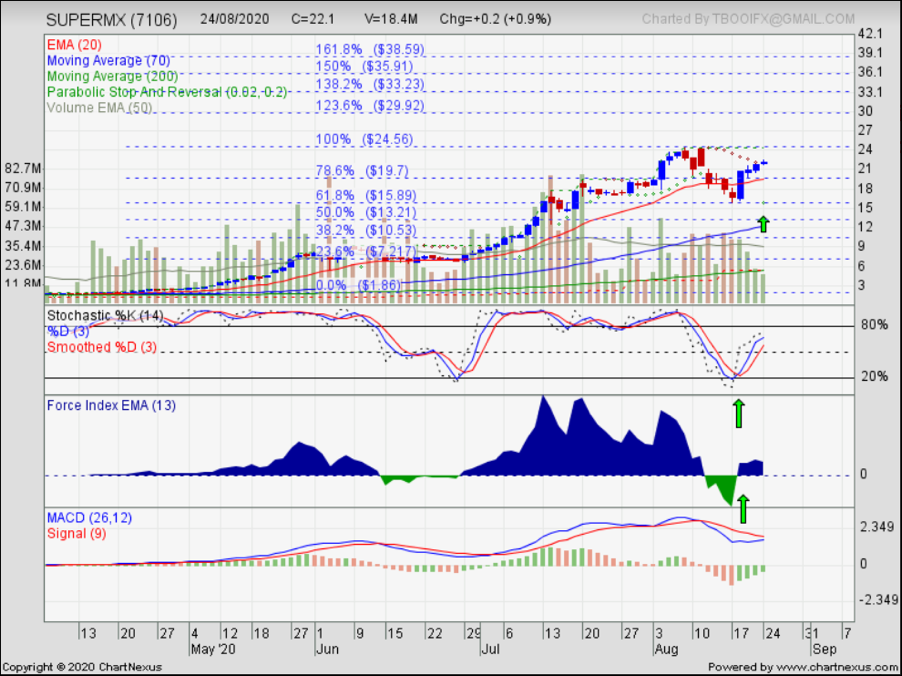
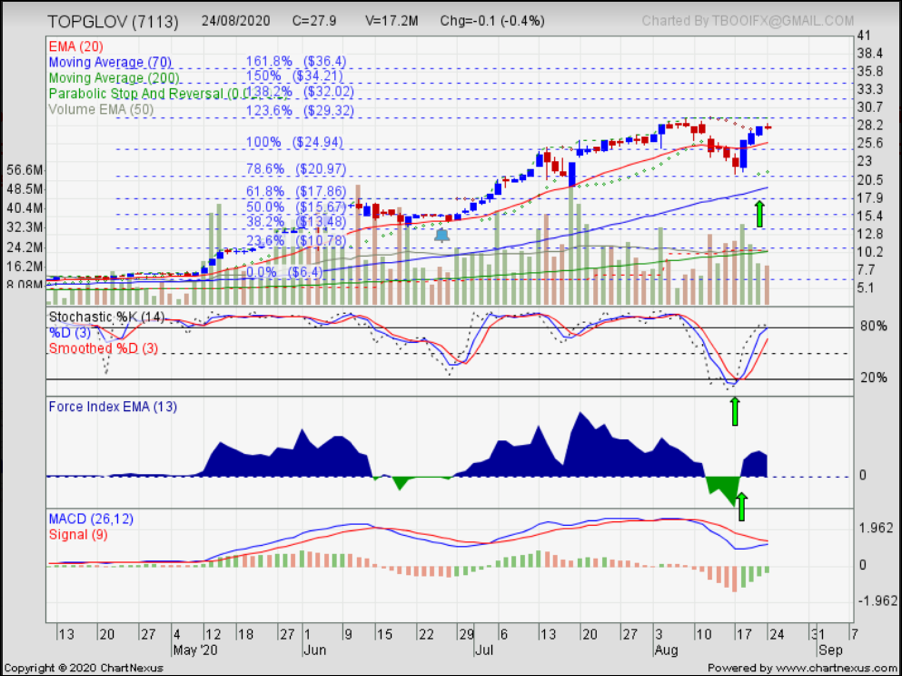
Based on the 2 charts for Supermax and Top Glove, Mr Ooi Teik Bee, our expert chartist, made the following comment: Both the share prices of Supermax and Top Glove are at the beginning of Wave 5, I believe the share prices will continue to hit new highs until you cannot believe it.
- Parabolic SAR is just appearing for both charts, it confirmed that the technical charts are in super bullish mode.
- MACD buy signals will appear in both charts in the next few days. Once MACD buy signal appears, it will show the uptrend momentum is strong because the MACD buy signal appears above the zero line.
- The target price of this Wave 5 based on the technical chart for Supermax is around 38.60.
- The target price of this Wave 5 based on the technical chart for Top Glove is around 36.40.
When I asked him how can Supermax target price be higher than Top Glove. He said that Supermax recently announced its 4thquarter, ending June with EPS 30.58 sen which has been attracting more buyers than Top Glove. Top Glove will only announce its next quarter result, ending August before end of October which is expected to be the best in the history of the company.
Due to Covid 19 the demand for medical glove will continue to exceed supply until the pandemic is under control. As a result, all glove makers can easily increase their selling prices to make more and more profit.